A Fresh Look at Using the Income Approach to Valuing FLPs

When I value minority interests in a family limited partnership (FLP), I will do an income approach, but I will not enjoy it. All too frequently, the FLP does not generate regular distributions or regular profits. Plus, I’ll have to guess when the FLP is going to be liquidated: five years, 10 years, or perhaps never. By the way, what will the property be worth in five years—or 10 years? Is it appreciating at a 3% annual rate? Who knows? Usually not even the real estate appraiser is willing to go out on a limb, so how am I supposed to know? To me, this means an income approach is nothing more than a guessing game.
What I prefer to do is use an alternative approach where I value the asset (usually with the help of a real estate appraisal or brokerage statement) and take the appropriate discounts with the help of BVR and Partnership Profiles data. This is essentially a combination of the asset approach and the market approach.
A few weeks ago, I sat in on Partnership Profiles’ excellent one-day seminar on valuing FLPs Afterward I decided I need an attitude adjustment regarding the income approach.
NAV method
During the seminar, Partnership Profiles starts with an asset approach to value, which it calls the most commonly used method to value limited partnerships. The approach calculates the net asset value (NAV) of the partnership and applies average discounts for lack of control (DLOC) and lack of marketability (DLOM) based on studies, not specifically comparable transactions.
What’s wrong with this NAV method? Partnership Profiles doesn’t like it because the method:
- Ignores income-generating ability;
- Doesn’t quantify future benefits;
- Relies on overall averages from studies; and
- Is inappropriate for noncontrolling interests.
Thus, since a minority interest holder cannot compel the sale of the FLP, the NAV method should not be used. The courts don’t like the method either primarily because of inadequate comparisons to averages.
Income approach
Using the income method, you make a forecast of cash flows, making assumptions for increases in rent, operating expenses, interest income, and so on Next, you create two or three scenarios: that the FLP continues into perpetuity, that it is liquidated in five years and in 10 years A discount rate is developed based upon the risk attributes of the assets owned in the partnership and the required return on assets relative to comparable investments There are two primary sources of data: REITs and publicly held real estate limited partnerships (RELPs) Partnership Profiles keeps track of REIT rates of return over time horizons ranging from 20 to 40 years It keeps track of the data for RELPs and splits the data among no to low debt, moderate to high debt, and distributing and nondistributing partnerships
A build-up method is used that equals the risk free rate plus a real estate risk premium plus a specific risk premium.
Let’s take an example Assume that net asset value is $200,000 Let’s also assume the discount using REIT data is 13% and the discount using RELP data is 17% Partnership Profiles takes an average and arrives at a discount rate of 15% Let’s also assume that long-term growth is 2% and the value represents a 1% interest.
Three scenarios
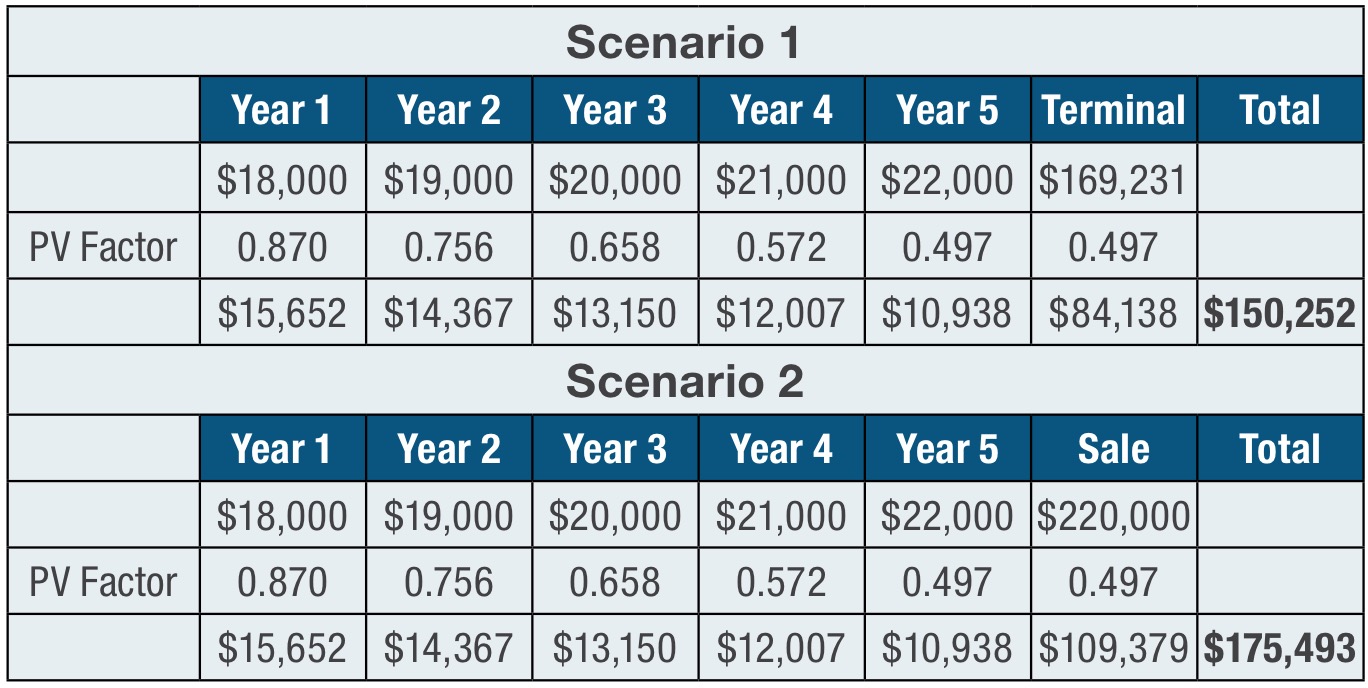
In the first scenario, assume a property will be held into perpetuity Using the 15% discount rate and 2% long-term growth rate, the terminal value equals fifth-year cash flow divided by 0 13 (0 15 0 02) Ignore the midyear convention for this example The net present value (NPV) is $150,252 Since NAV is $200,000, this represents a discount for lack of control of $49,748, or 24.9%.
In the second scenario, assume the property will be sold and the FLP will be liquidated in Year 5 The appreciated property plus cash less liabilities and transaction costs will net $220,000 The NPV is $175,493. Since NAV is $200,000, this represents a DLOC of 12.3%.
In the third scenario, assume the property will be sold and the FLP will be liquidated in Year 10 The appreciated property plus cash less liabilities and transaction costs will net $300,000 The NPV is $181,473. Since NAV is $200,000, this represents a DLOC of 9.3%.
Assuming that each scenario has an equal chance of taking place, the average DLOC would be (24 9 + 12 3 + 9 3)/3 = 15.5%.
Another way to express this is that a 1% interest equals the average of $150,252, $175,493, and $181,473, or $169,073.
Market approach
This approach compares attributes of the subject partnership to partnerships of similar attributes. Partnership Profiles keeps track of resale transactions involving noncontrolling interests in nontraded publicly held limited partnerships and REITS. Trading volume in this market has declined from $110 million in 1994 to $48 million in 2013. Price-to-NAV discounts on these partnerships ranged from 44% in 1992 to 32% in 2012.
The discount depends on the degree of cash distributions. For example, a nondistributing LP discount averaged 46% in 2012, compared to a distributing partnership with little or no debt, which had an average discount of 23%. According to Partnership Profiles, most of the discount is due to lack of control. Perhaps 10% of the overall discount is due to lack of marketability.
Partnership Profiles offers price-to-NAV discounts in its Minority Interest Discount Database Data are available over the past 20 years and include 360 partnerships. Select the most comparable partnerships, determine the price-to-NAV discount, and apply that number to the subject NAV. Assume you arrive at 0.820 based on your examination of the partnerships that are similar to the subject FLP. Using a market approach, the value of a 1% noncontrolling marketable interest is $200,000 × 0.820 = $164,000 or a DLOC of 18%.
Reconciliation
Assuming you have equal faith in the income and market approaches, then you arrive at $166,537 (($169,073 + $164,000)/2) for the value of a 1% noncontrolling marketable interest, which is an effective DLOC of 16.7%. The result: a noncontrolling, marketable interest.
The next step in this example is to develop the DLOM.
DLOM
Partnership Profiles has a different perspective on DLOM It prefers to look at it as the increased return required to compensate for the increased risk of an illiquid investment Citing three research studies, Partnership Profiles suggests that investors require a 30%-to-45% increase in their rate of return for an illiquid investment For example, a marketable investment that returns $75,000 would have to return $100,000 if nonmarketable That’s a 33% premium required for a nonmarketable investment Or, if you prefer, a $100,000 value that is nonmarketable is discounted 25% to arrive at a nonmarketable value
The first study looks at private equity versus public equity returns Quoting from Cambridge Associates LLC, Partnership Profiles notes that privately held stocks have returned an average of 18.7% over the past 25 years compared to publicly traded small stocks, which returned 12.9%, for an incremental return of 45% ((0.187-0.129)/0.129)
In its second analysis, Partnership Profiles looks at restricted stock studies and found that the average increase between the return using the restricted stock price and the return using the publicly traded price was about 30%.
The third analysis compares average long-term to short-term government bond returns. For a long-term bond to be equally marketable, investors demand an increase in the rate of return. Over the past 30 years, the average incremental return has been 39%.
Using the three studies, the incremental returns are 45%, 30%, and 39%, or an average of 38% in incremental return—which equates to a DLOM of 27%.
Final result
Applying the 27% DLOM to the $166,537 value of the 1% noncontrolling marketable interest yields a DLOM-adjusted value of $121,572.
I was fortunate to have the chance to speak with Bruce Johnson, ASA (Munroe, Park & Johnson Inc.), co-author of the Comprehensive Guide for the Valuation of Family Limited Partnerships. Munroe, Park & Johnson is also the co-sponsor of the Partnership Profiles FLP Valuation seminars.
Stuart Weiss: I used to say I’m not going to do an income approach because I don’t have enough information. It would be like trying to do a DCF when management doesn’t do projections. Besides, it’s just going to add to the fee, so I’m not going to do it. What’s wrong with my thinking?
Bruce Johnson: This is what changed me: The first time I testified in Tax Court, I had an income approach but not a market approach. The expert that I went against had both. I thought he had taken liberties with both approaches, and when I compared my income approach to his income approach the judge could see that. But when it came to the market approach, there was nothing to compare it to I just had to attack some of his assumptions.
With an FLP, the market approach makes a lot of sense. You can find comparable entities out there—looking at their price-to-NAV ratios and get a noncontrolling marketable value. Now, with the income approach, a lot of people try to capitalize dividends, but capitalizing is for a company that has an infinite life. Most FLPs have a finite life. Even when the general partner has not announced a liquidation date, investors assume about a seven-to-eight-year liquidation horizon .You need two things: a rate of return and your future benefit, which can usually be quantified by looking at a DCF model. What is the annual income you’re going to get (if any) and what is the value at liquidation? A lot of these don’t make it to their 20-to-30-year terms. The property gets sold, or somebody dies Typically, we use two scenarios, a five-year liquidation and a 10-year liquidation. We have the real estate market value as of the date of liquidation. All we have to do is forecast the appreciation rate. It’s fairly straightforward to forecast the annual income generated by the partnership and then what it would sell for in five years if it appreciates at 3% to 5%.
SW: It just seems like the ones that I do are much more erratic. There might be income but no distribution. There might be income but no distribution. Do you assume that the cash flow is the ability to pay the dividend or the actual dividend?
BJ: We assume the ability to pay You either have to forecast the distribution of income or show where that income is going It’s got to be reinvested in some other asset I think it’s more straightforward and easier to explain, and IRS Revenue Ruling 59-60 refers to the income-generating ability of the company So we forecast 100% of the profit being paid out, with the liquidation in five or 10 years
SW: Because they are pass-through entities, do you do a tax adjustment?
BJ: No, we don’t We find that they are low income-producing entities and most of the return is in the liquidation Raising the tax-affecting issue with the IRS raises another issue when they already don’t like FLPs, so we just don’t get into that issue
SW: I noticed that you weight the market and income approach 50-50 Typically, in a regular business you would weight the income approach higher. Did you do 50-50 to make it a simple example?
BJ: No, that’s what we normally do here The market and income approaches should come out fairly close, so it doesn’t matter what the weight is Sometimes, the Partnership Profiles data have better partnerships than my subject They’re bigger and have a longer history, so I might weight the income approach higher.
SW: You spend a lot of time on the venture capital data for DLOM. But you don’t see that in the analysis of regular companies.
BJ: We’ve been doing it for 20 years and actually had the IRS call us and tell us that they like it. Usually, our DLOMs are about 25%. We end up with marketable securities at the 30%-to-35% range, income producing real estate in the 35%-to-40% range, and non-income-producing real estate in a 40%to-50% range as far as total discounts.
I testified in the first FLP case to go to court, and the IRS wanted to argue discounts, and I argued rate of return. Nobody knows what a fair discount is, but everybody knows what they can get in a CD, in bonds, in stocks. If your rate of return is 15% to 20%, you’re probably pretty reasonable, but if it’s a 30%-to-40% return, then you’ve discounted the heck out of it. I like to get the IRS in a discussion about rates of return, not whether the discount is too high or too low.
SW: Where does the world stand in terms of FLPs and discounts? Are discounts going to be around, or are they still under threat of being legislated out?
BJ: They’re a very successful planning tool, so I think they’re always under threat. Every year, the Treasury Department proposes to eliminate them, but it never gets passed. Everybody uses them, and they’ve been held up in court. Where the IRS has been more successful is with people who don’t set FLPs up correctly and don’t treat them as arm’s-length entities.
For more information. Johnson recently conducted a webinar for Business Valuation Resources where he discusses his approach in more detail. A recording of the webinar, using the Empirical Method for Determining DLOMs, is available at BVResources.com/training.